As announced in a previous article, ESonix is on the way.
Although it is still in active testing phase, we can now provide a short overview of its functionalities.
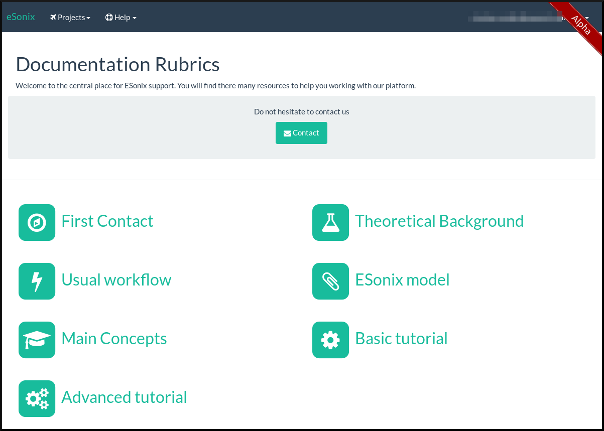
Extensive Documentation
Many resources are provided throughout ESonix extensive documentation.
Step by step tutorials
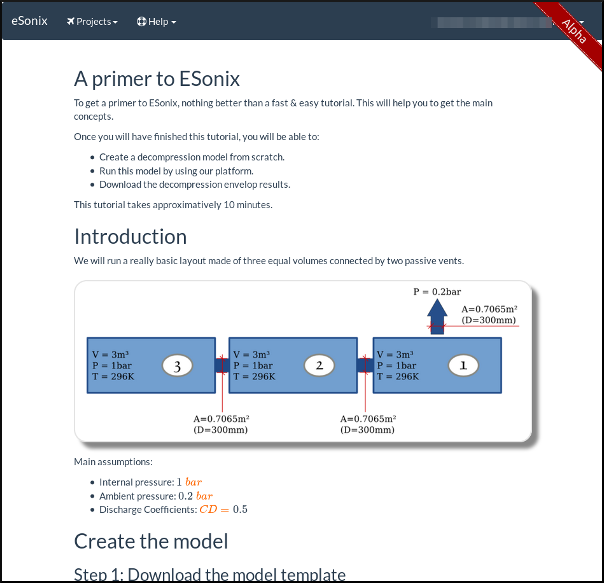
Easy to learn, easy to use
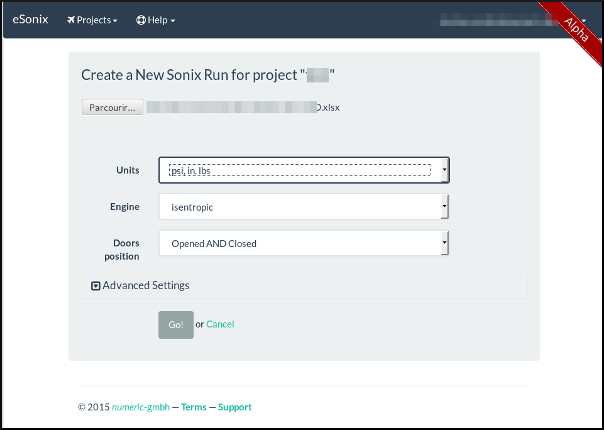
We made some strong efforts to make ESonix easy to learn and easy to use.
Download envelops as Excel files
Very detailed \(\Delta_p\) envelops are downloadable as Excel Spreadsheet
Extensive dynamic post-processing capabilities
Data are sorted by Decks associations to sort data by valuable association.
The screenshot below shows all the main Deck to main Deck interfaces (whatever your interfaces are: bulkheads, cabinets, etc.*) absolute values in the horizontal axis, and all the load cases in vertical axis.
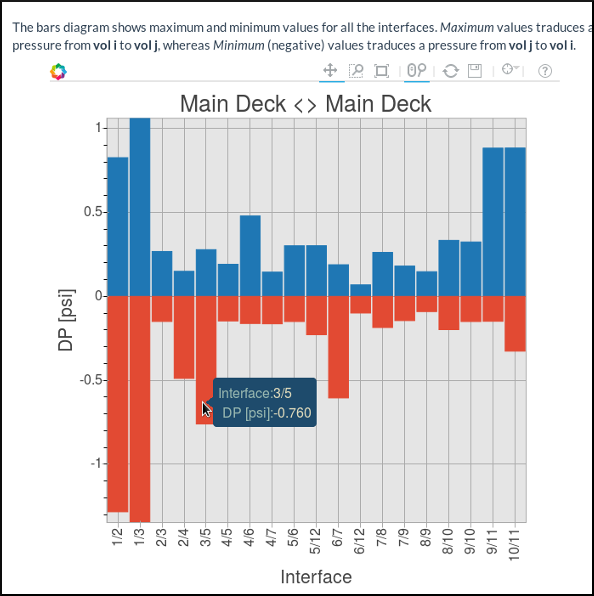
Some useful tooltips pops up when data are highlighted by the mouse.
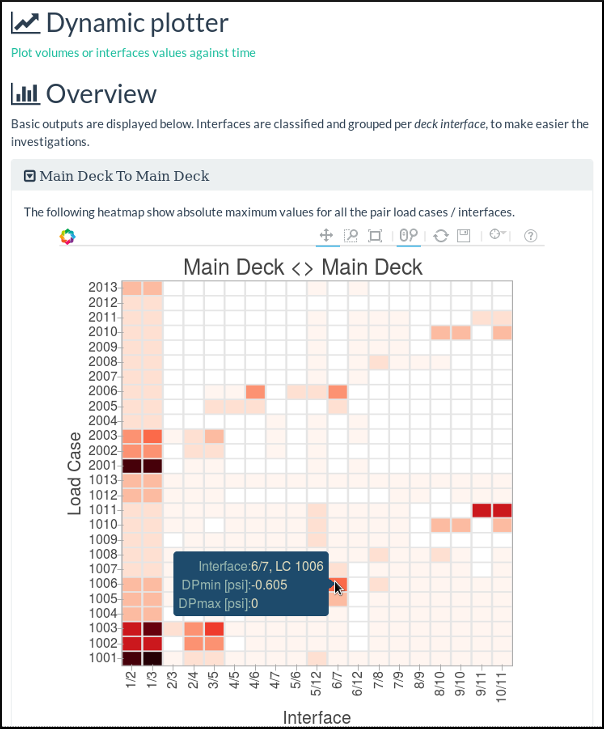
The following overview summurizes the above heatmap by displaying the max values for each interface in its two directions.
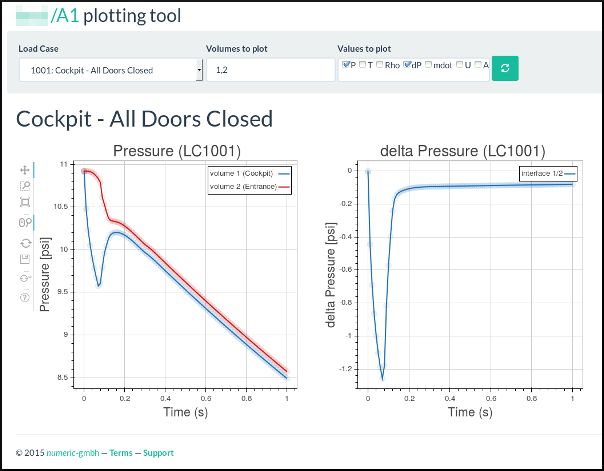
Plot data against time
You can plot any data you like against time. For example, the following figure shows the evolution of pressure for volumes ID 1 and 2, and the \(\Delta_p\) for the interface between volumes 1 and 2.
And much, much, more…
Stay tuned!